Benchmark results Harpy#
Below, we present figures illustrating the benchmark performance of Harpy.
We evaluate two representative workloads: (i) shallow feature extraction from multiplex images, defined here as the computation of mean intensities per instance, and (ii) the generation of single-cell representations from multiplex images.
The benchmarks were performed on a tonsil proteomics dataset acquired using the MACSima platform, and on a dataset acquired using the Merscope platform.
Both datasets were artificially enlarged: the tonsil dataset was tiled to 40 gigapixels, while the Merscope dataset was expanded to 1 terapixel. This was done to stress-test Harpy on two computationally demanding tasks typically run before downstream analysis.
The figures shown correspond to CPU-based execution. Note that Harpy also supports GPU acceleration via cupy
, which can provide additional speedups for large datasets.
Next, we focus on the gigapixel case (the 40‑gigapixel tonsil dataset) before moving to the terapixel benchmark.
Gigapixel case#
Read the data:#
import os
import tempfile

from spatialdata import read_zarr
import harpy as hp

sdata = hp.datasets.macsima_tonsil_benchmark()  # note this dataset is large (~100GB)
sdata.write(os.path.join(tempfile.gettempdir(), "sdata.zarr"), overwrite=True)
sdata = read_zarr(sdata.path)
sdata
WARNING  Module 'bioio' is not installed. Install it with `pip install bioio` to use `harpy.io.macsima`.
WARNING  Module 'bioio-ome-tiff' is not installed. Install it with `pip install bioio-ome-tiff` to use
         `harpy.io.macsima`.
SpatialData object
├── Images
│     ├── 'image_tiled': DataArray[cyx] (100, 20000, 20000)
│     └── 'image_tiled_dapi': DataTree[cyx] (1, 20000, 20000), (1, 10000, 10000), (1, 5000, 5000), (1, 2500, 2500), (1, 1250, 1250)
├── Labels
│     └── 'labels_cells_harpy': DataArray[yx] (20000, 20000)
└── Shapes
      └── 'segmentation_mask_boundaries': GeoDataFrame shape: (206030, 1) (2D shapes)
with coordinate systems:
    ▸ 'global', with elements:
        image_tiled (Images), image_tiled_dapi (Images), labels_cells_harpy (Labels), segmentation_mask_boundaries (Shapes)
This dataset contains 206,030 instances:
import dask.array as da

da.unique(sdata["labels_cells_harpy"].data).compute().shape  # the dataset contains 206030 instances
(206031,)
The image element under the key “image_tiled” was obtained by artificially tiling the “ROI1_image” output of harpy.datasets.macsima_tonsil() into a 3D image layout with dimensions (c, y, x) = (100, 20000, 20000) ~40 giga-pixels.
The cell segmentation mask stored under the key “labels_cells_harpy” was generated using Cellpose (version 4) applied to the “image_tiled” image element.
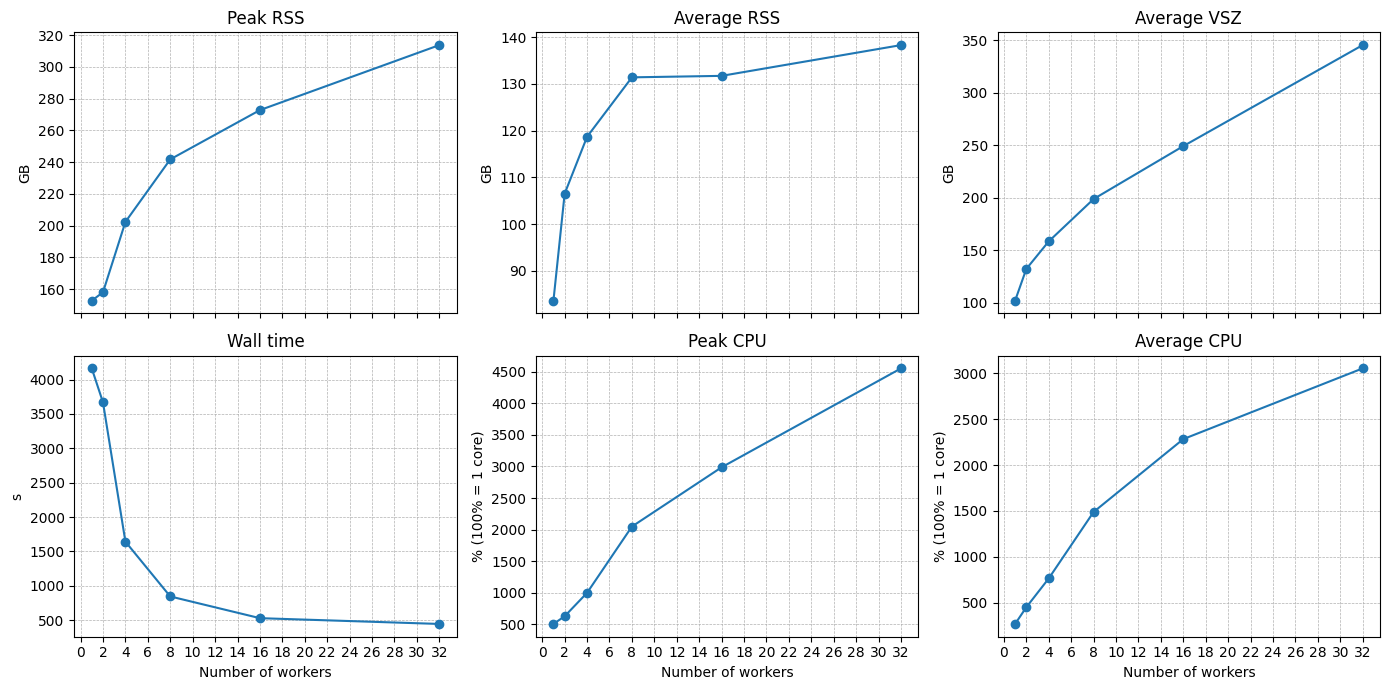
Benchmark shallow feature extraction:#
from dask.distributed import Client, LocalCluster
from harpy.utils._aggregate import RasterAggregator

cluster = LocalCluster(
    n_workers=8,
    threads_per_worker=4,
    memory_limit="48GB",
)

client = Client(cluster)

image_name = "image_tiled"
labels_name = "labels_cells_harpy"

image = sdata[image_name].data[:, None, ...]  # ( "c", "z", "y", "x" )
labels = sdata[labels_name].data[None, ...]  # ( "z", "y", "x" )

aggregator = RasterAggregator(image_dask_array=image, mask_dask_array=labels)
dfs = aggregator.aggregate_stats(stats_funcs=("mean"))

client.close()
We varied the number of workers and obtained the following figures.
from IPython.display import Image, display

display(Image(filename="../figures/output_aggregate_mean.png"))
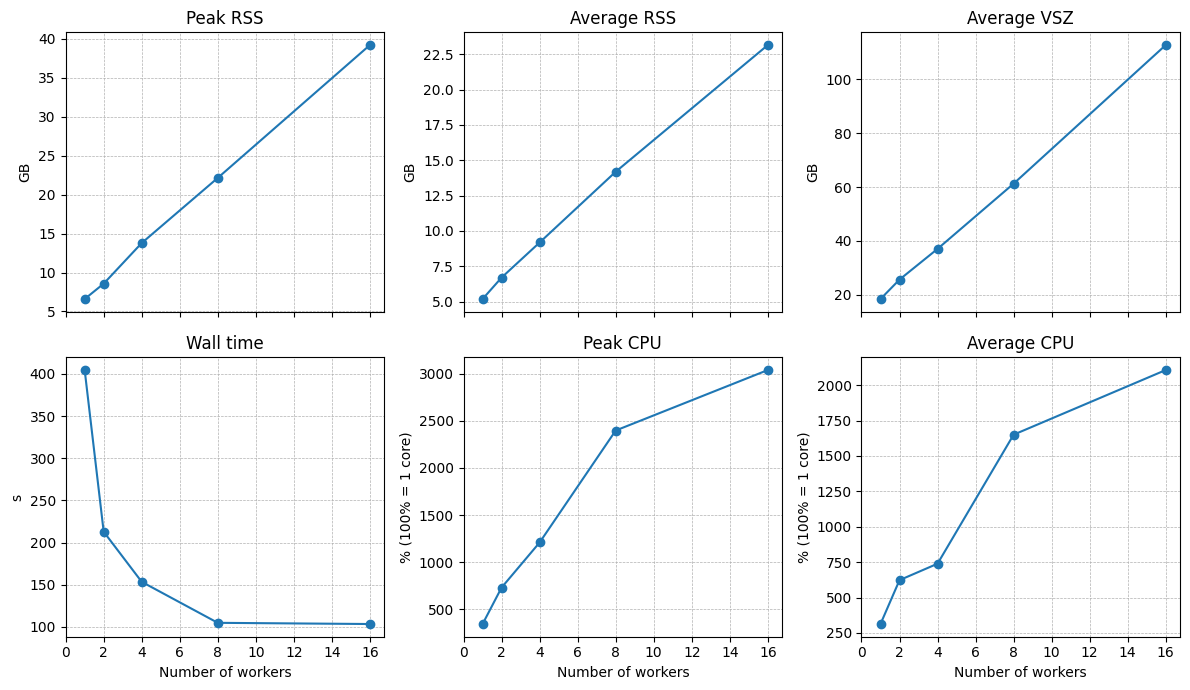
Benchmark generation of single-cell representations from highly multiplexed images:#
import os

from dask.distributed import Client, LocalCluster

from tempfile import tempdir

cluster = LocalCluster(
    n_workers=8,
    threads_per_worker=4,
    memory_limit="48GB",
)

client = Client(cluster)

image_name = "image_tiled"
labels_name = "labels_cells_harpy"

instances_ids, instances = hp.tb.extract_instances(
    sdata,
    image_name=image_name,
    labels_name=labels_name,
    depth=100,
    diameter=50,
    batch_size=500,
    zarr_output_path=os.path.join(tempdir, "zarr_folder"),
    overwrite=True,
)
We varied the number of workers and obtained the following figures.
from IPython.display import Image, display

display(Image(filename="../figures/extract_instances.png"))
Terapixel case#
Read the data:#
import os
import tempfile

from spatialdata import read_zarr
import harpy as hp

sdata = hp.datasets.merscope_mouse_liver_segmentation_mask()
sdata.write(os.path.join(tempfile.gettempdir(), "sdata.zarr"), overwrite=True)
sdata = read_zarr(sdata.path)

# artificially tile the data:

sdata = hp.im.add_image(
    sdata,
    arr=da.tile(sdata["clahe"], (50, 1, 1)).rechunk((10, 2048, 2048)),  # Note this array is large ~1.5TB
    output_image_name="clahe_tiled",
    overwrite=True,
)
The image element under the key “clahe_tiled” now has dimensions (c, y, x) = (100, 100000, 100000), totaling 1 terapixel (10¹² pixels).
The cell segmentation mask stored under the key “segmentation_mask_full” was generated using Cellpose (version 3) applied to the “clahe” image element. The cell segmentation mask contains 278,482 instances.
Benchmark shallow feature extraction:#
from dask.distributed import Client, LocalCluster
from harpy.utils._aggregate import RasterAggregator

cluster = LocalCluster(
    n_workers=8,
    threads_per_worker=4,
    memory_limit="243200MB",
    local_directory=os.environ.get("SCRATCHDIR") or os.environ.get("TMPDIR"),
)

client = Client(cluster)

image_name = "segmentation_mask_full"
labels_name = "clahe_tiled"

image = sdata[image_name].data[:, None, ...]  # ( "c", "z", "y", "x" )
labels = sdata[labels_name].data[None, ...]  # ( "z", "y", "x" )

aggregator = RasterAggregator(image_dask_array=image, mask_dask_array=labels)
dfs = aggregator.aggregate_stats(stats_funcs=("mean"))

client.close()
We varied the number of workers and obtained the following figures.
from IPython.display import Image, display

display(Image(filename="../figures/output_aggregate_mean_merscope.png"))
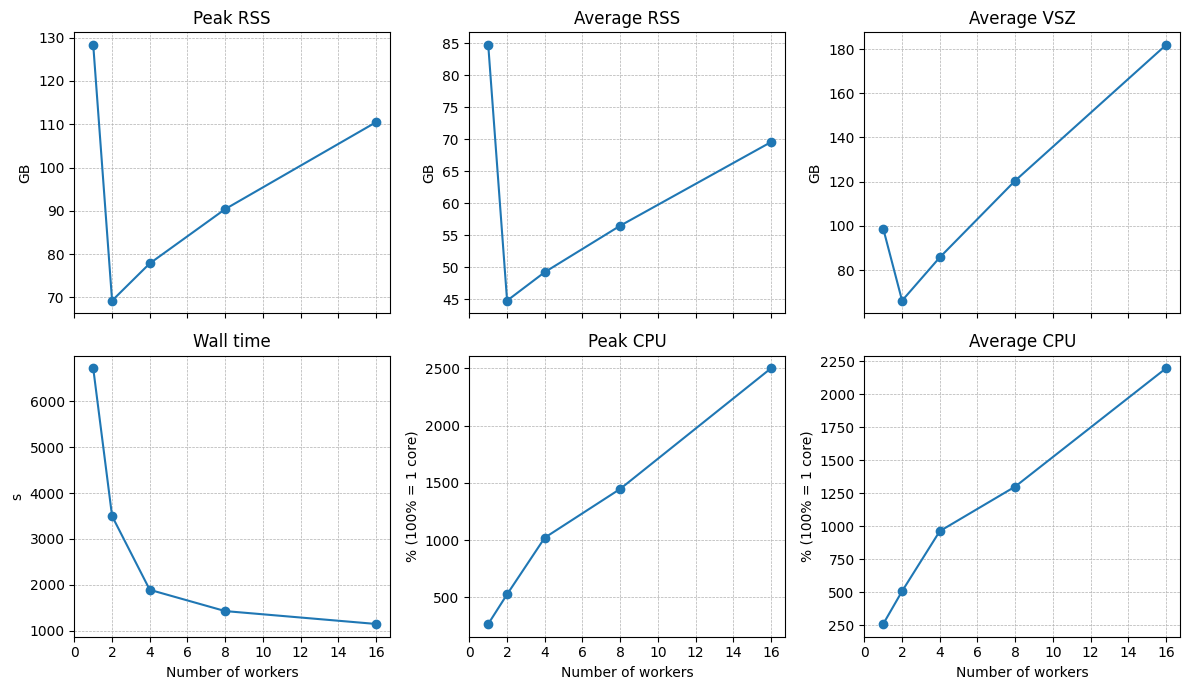
RSS (and VSZ) appears to spike at 1 worker, likely due to Dask holding onto chunks when parallelism is low.
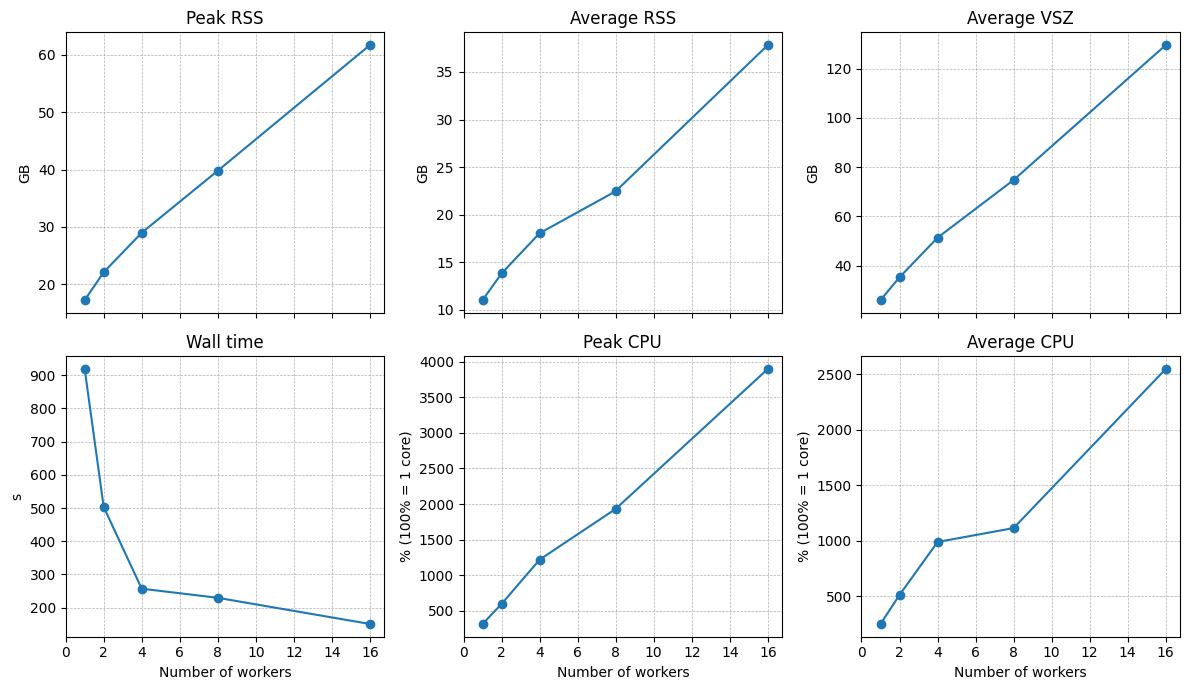
Benchmark generation of single-cell representations from highly multiplexed images:#
import os

from dask.distributed import Client, LocalCluster

from tempfile import tempdir

cluster = LocalCluster(
    n_workers=8,
    threads_per_worker=4,
    memory_limit="243200MB",
    local_directory=os.environ.get("SCRATCHDIR") or os.environ.get("TMPDIR"),
)

client = Client(cluster)

image_name = "image_tiled"
labels_name = "labels_cells_harpy"

instances_ids, instances = hp.tb.extract_instances(
    sdata,
    image_name=image_name,
    labels_name=labels_name,
    depth=200,
    diameter=100,
    batch_size=500,
    zarr_output_path=os.path.join(tempdir, "zarr_folder"),
    overwrite=True,
)
We varied the number of workers and obtained the following figures.
from IPython.display import Image, display

display(Image(filename="../figures/extract_instances_merscope.png"))